Thursday, October 26, 2017

Basic HTML, CSS, and JavaScript

Goal and Background:

This lab is designed to introduce students to html, css, and javascript.  They will create their own website using html and give it life using css and javascript.  Having the ability to customize websites and create them from scratch has no limits to its value because with these skills, a person can create amazing interfaces to work with a map and more.

Methods:

The lab began by creating an HTML document in Notepad ++.  This was done by simply saving the file as a .html.  The html page was then formatted in the typical way a html page is formatted.  This consists of calling out the DOCTYPE as html, adding html, head, and body tags.  This is the basic format any html page should be set up as.  The next step was adding content to the webpage.  In html this is done very simply by adding a specific tag and putting text in that tag.  A title tag was added in the header with a title as well as four headers in the body.  


A few more lines of coded were added as paragraphs to show that the emphasis tag made text italic and the strong tag made text bold.  Next, a list was added to show how the list and list items tags worked.  This is very simple html but is key in adding content to a website.  The image below is what the html created looks like on a webpage.


This webpage has content but lacks design.  Cascading Style Sheets or CSS is a language that is used with html to give webpages color and design.  The next step to creating a good webpage was to open a new file in Notepad++ and to save is a CSS file.  CSS was then added to this page.  CSS is a simple language that calls out sections of the html code and gives is color and other parameters.  This is done by using a selector in css to select an element, specific object or group of objects in the html file.  Below is a sample of the css code written in this lab. 


This code calls out specific sections of the html and gives is color, fonts and borders.  This css page is then linked to the html page by calling the file in the html page.  Once this is done, the html page is given design.  The image below is what css does to the bland html page. 


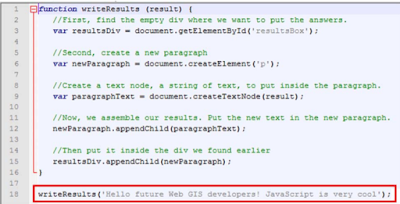
  The page is now starting to look like a real website. This is the basis of what was done in this lab, more code was added to add an input box as well as make the page look better.  A picture of the Web Mapping Application created in Lab 3 was also added with a link.  This is a good start to having a quality webpage.  The next step was adding some JavaScript to bring the webpage alive.  HTML and CSS are languages useful for formatting webpages but JavaScript is a scripting language that gives it the power to "think."  In this lab, JavaScript was written to combine text used in html to make a paragraph and display it in the webpage.  Below is an example of the script used,


The sample webpage was now complete and it was now time to create a mock webpage for a business showcasing a webGIS application.

Results:

Throughout a Geography students career at the University of Wisconsin-Eau Claire, they are required to make blog posts for many assignments in a variety of classes.  A lot of people use the blogger website (like me) and some people use weebly.  These blogs are then to be used as an online portfolio to showcase their work to future employers.  When they are getting to the point of looking for internships and jobs, they may discover that they want to make their blog page and profile look nice and fit seamlessly together.  They then discover that this task is very difficult using a template blog website like blogger.  No longer is this a problem!  This lab has taught the skills necessary to ditch blogger and create a website from scratch!  By the end of this class it will be possible for a standalone website to be created as an online portfolio.  This lab has laid down a solid foundation of HTML, CSS, and JavaScript skill needed to do this.

Sources:

Cyril Wilson

Thursday, October 12, 2017

Web App Builder

Goal and Background:

This lab was designed to introduce the students to building web applications using the WebApp Builder for ArcGIS online and using the developers editions.  No coding was actually done this lab but the basics of building and customizing web apps was introduced to have the knowledge needed when coding custom applications.

Methods:

This lab began with creating a web application similar to last lab using the online web app builder. Once this application was complete, it was to be brought into the developer edition of WebApp builder.  This is a more developer friendly version of the WebApp builder.  The developer edition gives the developer more power to customize and code their own applications.  In this case, the app created in the online WebApp builder did not transfer over to the developer edition.  The lab hinted that there were work arounds to get the app to transfer to the developer edition, or the app could just be recreated using the developer edition.  In this case, the app was not too complicated so it did not take long to recreate it in the developer edition.  Once the app was recreated, a custom widget was added to the widgets folder in the program files for the developer edition of the WebApp builder.  This custom widget was an elevation profile widget.  The widget folder was provided to the class and the tool was already completed.  This was simply copied and pasted into the program files.  This widget was now available in the widget section of the WebApp builder.  The following image is a screen shot of what the application looks like when it was completed.


To get this app to the internet from the developer edition, the computer needed to be connected to the gis server and the map could then be viewed from a url based off the folder path on the server.

Results:

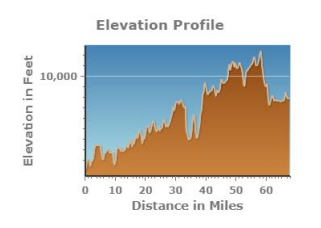
The online version of the WebApp builder is useful for a lot of web GIS situations.  For publishing maps and having a way to make them look good and be interactive this will satisfy that need.  To create web apps with powerful customized processing capabilities, the developer edition will have to be utilized.  Widgets can be created for almost any tool that is available in ArcMap Desktop, but a person will have to be well versed in coding.  This would be useful because once an app was created, people with little to no GIS experience could perform complex operation without even knowing it.  If an app is well put together the person using it will have no difficulties understanding what they are doing.  For example, creating an elevation profile in desktop is a bit of a process.  The elevation profile widget allows for this to be done in the blink of an eye.  The following image is a screenshot of what the elevation profile widget provides.

To use this widget, the user just needs to drag a line and gets this chart as a result.  The user can also download a excel table with the same data.  There are a few things that make this tool not as powerful as desktop.  It uses a topographic map and not a more detailed elevation model.  This would be very hard, if not impossible to get good elevation models for such a large area as the U.S.  let alone host all that data on one map.

Conclusion:

Web Applications in ArcGIS online and portal can be very powerful.  The developer edition gives the developer the capability to make even more powerful and customized apps.  In the right hands, an application can be created that performs complex processing operations without the user even knowing what is going on behind the scenes.  This is the bases of a good application, a map that is seemingly simple to the user but in reality there is complex operations going on behind the scenes. 

Sources:

Cyril Wilson, USGS, ESRI

Wednesday, October 4, 2017

Geospatial Web Services

Goal and Background:

The goal of this lab is to introduce the concept of creating geospatial web services through ArcGIS online, ArcMap, and ArcGIS Pro.  These services are hosted through the University of Wisconsin - Eau Claire Geography web server.  During this lab vector, raster and Excel/CSV data will be published.  This lab is designed to teach a basic understanding of one of the most important concepts in WebGIS, services.


Methods:

After the data provided by Professor Wilson was downloaded, the first step was to publish a service using ArcGIS online.  This is done by choosing the file to be uploaded in the "My Content" tab of ArcGIS online.  The .zip folder is selected and once appropriate tags are added the file is ready to be published.  "Add Item" is clicked and the item is published.  This layer was then added to a web map.  The following image is a web map of Wisconsin transportation created from the data uploaded using the online method.
Figure 1
This same method can be done using tabular data.  The next part of the lab was to save an Excel table as a CSV and then publish it as a service using ArcGIS Online.  This was very simple, the file was saved as a CSV file then the same exact process was used as above to import the X,Y data.  Latitude and longitude were selected and points were created as a service.  In this case, the XY data was representing wildfire in the United States.

Publishing a service through ArcMap is one of the most common ways to do it.  To do this, a map must be created and the data must have proper labels, field names, and symbology. Once the map is ready, the user needs to sign into ArcGIS online in ArcMap and the service is ready to be published. The user then shares the map as a service to the appropriate place in ArcGIS online and selects a few settings to optimize the map to what it will be used for.  The map is then published and shows up in the user's content in ArcGIS online.

The next method is publishing data using ArcGIS Server through ArcMap.  This is done in a similar way as previously but requires storing the data in a different place and connecting to the server.  Once the map is created the user must connect to the enterprise geodatabase.  This is where the data is stored that is pushed to the server. In this situation, each user is connected to their own enterprise geodatabase.  The data in the map should then be moved into this geodatabase.  The data in the map should then be mapped to this file and not the one in the local drive.  The next step is to publish the service.  This is the same process as publishing it to ArcGIS Online except it is being published to the server.  The place it is being published to is changed to the server address and the user is prompted to give the proper credentials.  Once this is completed the service can be published the same as before.  The service is now published to the UWEC Enterprise Server.

GIS is a relatively young field and is changing everyday.  ArcGIS Pro is the next big thing that will eventually phase out desktop.  The last part of this lab went through publishing a service to portal using ArcGIS Pro.  Once a map was created in pro with the proper data.  The map was shared as a web layer.  The appropriate summary and metadata information was provided and the map was then shared to the portal.  In this case it was actually shared to the server because the Universities portal was not up and running.


The last step of this lab was to create a map document, create a feature service, and add it to a web map.  This was done using ArcMap and published to the server.  Once the map and data was on the server it was brought into a webmap using the server address. Any service can be brought into a webmap as long as the user has access to it. Below is the resulting map. This is a map of earthquakes and hurricanes in the United States and shows them with a timer over a period of nine years.
Figure 2


Results:

Publishing data through ArcGIS Online is quick and easy way to publish a service but it does come with a few limitations.  The data published will not be normalized, symbolized, or cleaned up like it can be done in ArcMap.  This method of publishing only allows for 5gb of data to be published.  This method of publishing a service would not be the most recommended way to do it.

Publishing data to ArcGIS Online through ArcMap is one of the most popular and efficient ways to do it. ArcMap gives the user more control over the data before it is published.  The data can be manipulated and changed to fit the users needs before it is published.  Once it is published it is harder to change things such as field names and certain symbology.

Publishing data to ArcGIS Server is slightly more involved but results in more security around data.  ArcGIS Server is data that is hosted on a GIS server rather than online.  GIS servers are normally internally to companies but can be hosted though a 3rd party.  Having an internal GIS Server results in more security and control of the data.  This method is the way to go if using ArcGIS Enterprise. 

ArcGIS Pro is the next big thing in GIS.  ESRI claims it will eventually phase out ArcMap Desktop all together.  It is slightly easier to use but more confusing to use when the user does not have a lot of experience. Publishing was not harder or easier it was just different.

Using services in a webmap is very valuable.  There are many free services of valuable information published and hosted by private and public entities.  These can be brought into any webmap and shared.  This can be very useful in many real world situations.


Sources:
ESRI, Cyril Wilson, NASA, USGS