In the world of data, data collection is expensive and tedious but necessary to give maps the life and power that they have. WebGIS has opened the doors for new opportunities for data collection, the internet allows map and data developers to have immediate access to the public. The public can then be used to collect data! In the world of GIS this is called Volunteer Geographic Information (VGI). Other areas of the internet have been using this technique (crowd sourcing) to compile lots of information. The most well known website that does this is Wikipedia. Wikipedia is open to the public to add information and contains almost every topic one can imagine. The field of GIS is now using this technique to collect all sorts of information.
In this lab a VGI app will be created that collects information about a cities infrastructure. Information about broken sidewalks, healthiness of vegetation in green space and the color of fire hydrants will be collected using VGI.
Methods:
To begin creating a VGI application, a feature service needed to be created with empty features for the point class Fire Hydrant, line class for Sidewalks, and a polygon class for Green Spaces. Domains were set for these features and they were given proper symbology. These features were saved in a map in the live server and then published to that same server. This allows the features to be accessed by people who are using the application.
Once the features are all set and published, the next step is coding the web application.
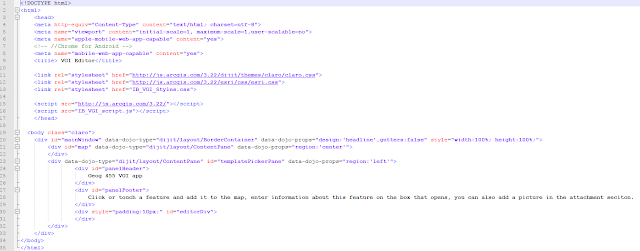
This first section of code is an html page that sets up the user interface for the application. It is important to have a user interface that is friendly to people who are not familiar with GIS. This html page calls in external CSS style sheets that create the borders and styling of the application. The html page then calls in the javascript that creates the map and calls in the features.
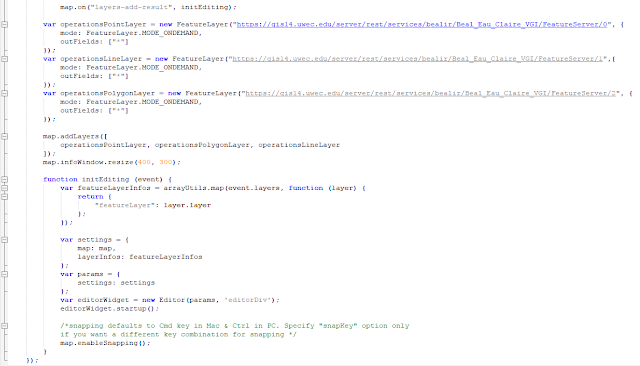
The image below shows the first part of the java script file that creates the map and calls in the features as feature services that were created in the first part of the lab.
The image below is a second screenshot of the js. file. At the top of the page, the three feature services are called in as variables in the map.
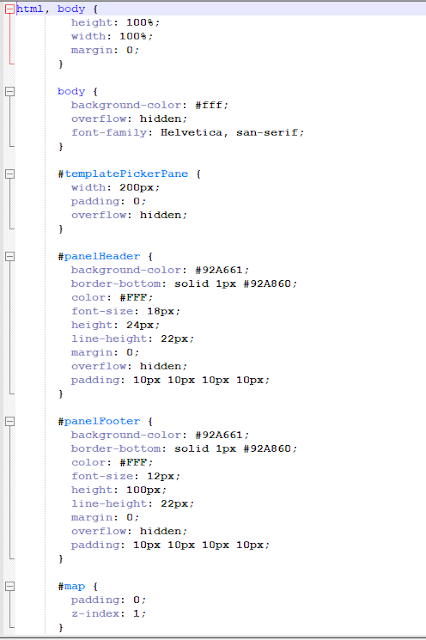
The last two images are a CSS page that sets the styling for the application. In this code, widths and heights are given to different sections of the code. This gives the page a user friendly layout that is easy to understand.
The next section of the lab modifies the code so that the application is more user friendly towards mobile platforms. The code from the above pages was copied and added to new files. A new page was also added in this section. The html page was changed to make it more mobile compatible, and call in the toggle javascript page.
The image below is the toggle page that was created just for this section. The toggle page creates two variables for a map zoom slider and a toggle page. It then uses an if statement to check if the size of the platform viewing the application is a certain size, and if it is, changes the size of the page.
The only changes to the javascript file in the second part of this lab was to change http to https when referencing the services on a secure server.
The css code was changed to reflect the toggle variable page that was added. A background image was also added to give the page some more life. Styling was given to the template picker that is used to turn the template picker on and off.
Results:
The resulting webpage created from this code is a simple webmap that is not distracting to the user with the feature toolbar on the left for user to select an element and add it to the map. The toggler on the top right of the page can be used to hide the toolbar on the left.
When the user clicks an element to add it, then clicks on the map, a pop up window comes up and prompts the user to enter attribute information.
VGI applications are very useful to collect information out in the world. People that live in an area are most likely much more familiar with the place then people who would just be surveying it. They can provide accurate information at no cost to the data producer. In the case of the application that was created in this lab, the people providing the information have self interest in the data so they will provide quality data. If they want their city to be fixed, they will provide accurate information.
Sources:
Ian Beal
ESRI
Dr. Cyril Wilson


No comments:
Post a Comment