Tuesday, December 5, 2017

Geoprocessing Services

Introduction:

In the world of GIS data is very valuable but being able to manipulate that data in a way that allows for analysis to take place is what makes GIS powerful.  This is done using geoprocessing.  This lab is designed to create a geoprocessing service and then incorporate that into a webmap.  A geoprocessing model will be created that solves multiple tasks, a geoprocessing service will be authored and published, and a Web GIS geoprocessing widget will be created to facilitate consuming that geoprocessing service.  In this lab, a mock business scenario is used as the objective of the geoprocessing service.   TFC Manufacturers is looking for a new area to put factories and needs to narrow their search area down based on a few criteria.  The locations must be close to a river, and a railroad as well as in close proximity to a city will a population greater than 4000.  The geoprocessing service created in this lab will allow the user to drop a point and it will show them the areas near that point that meet all of the criteria.

Methods:

The first step to this lab was to create a model in ArcMap that the geoprocessing service will be based on.  Figure 1 below shows the model that the geoprocessing service is based on.  This model was created by adding features (Rivers, Railroads, Wisconsin_Cities) and tools.  These tools were connected to the features and outputs.  The model begins by clipping the river and railroad classes based on the buffer from the point class the user added to the map.  These clips are then buffered based on a distance that the user inputs (default 5 km),  these buffers are then intersected into a River_Rail_Int output.  The Wisconsin_Cities class is first ran through a select tool that selects all the cities with a population greater than 4000.  These cities are then clipped based on the point buffer class that the user inputted.  These cities are now joined to the river and rail intersect class based on a spatial join.  Finally these classes are all dissolved and a single polygon class is the final output (Factory_OptimalLocation) that shows the optimal area for a factory in that area.  The proper classes were then set as parameters by right clicking and selecting model parameter.  This makes these inputs that the user can change when they use the model as a geoprocessing service. These parameters can be seen in the model by the P next to them.   
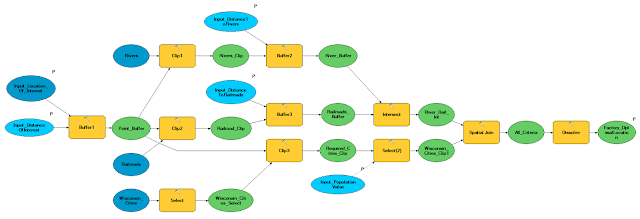
Figure 1: Model
After the model was created, it was time to publish the model as a geoprocessing service.  This was done by running the model then selecting it in the results windows and clicking Share As- Geoprocessing Service.  When publishing the service, the execution mode was set to asynchronous, the parameters were given descriptions, the map was given an item discription and the geoprocessing service was published.

The next step is to create a web map using the developer edition of the Web App Builder.  A simple web application is created and the geoprocessing widget is brought in.  The geoprocessing widget is then given the service created in ArcMap.  This is done by referencing the service url in the server it was published to.  The map name and other descriptions were changed to make the map more user friendly.  Once this was done the app was ready to be moved to the development server.  This was done by downloading the map and extracting it into the server.   


Results:

The model created above is a easy way to "write code."  The following image is python code that was created from the model.  It creates variables, sets parameters and determines when to run them.  This could be done by hand ArcMap provides the model builder for an easier more interactive way to do this.  This is the script that is behind the geoprocessing service that is added to the webmap.
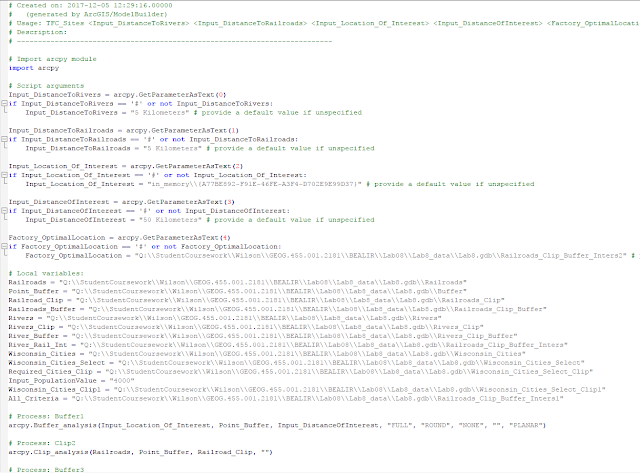
Figure 2: Python Code from Model 1

Figure 3: Python Code from Model 2
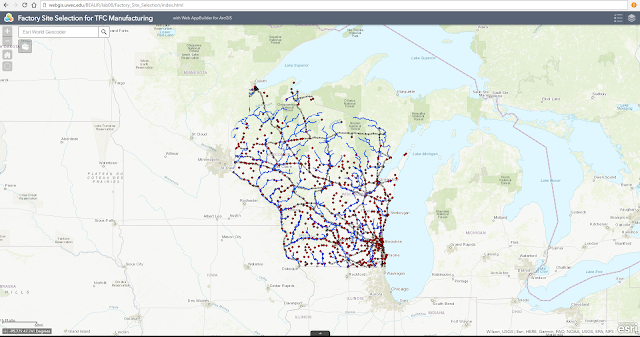
The developer edition of the Web App Builder was used to create the following web application.  It is a simple ESRI template but gives the user (TFC Manufacturing) what they need.  The user simply has to click on the geoprocessing widget in the top left corner under the search bar to access the geoprocessing tool.   

Figure 4: Final Map
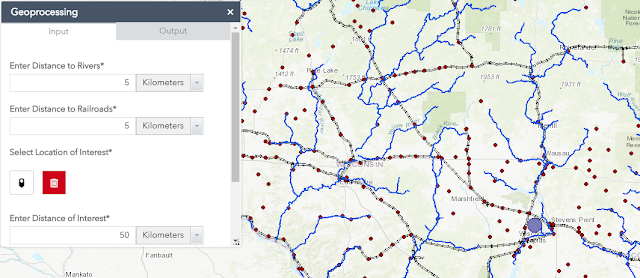
The user is then given the opportunity to change the parameters of the tool and select a point of interest.  The user simply clicks the location of interest button and then selects a location on the map.  They then scroll down on the tool and select the execute button. 

Figure 5: User Input
The geoprocessing tool then outputs the areas that meet all the criteria that were input above.  This output is given as a polygon.  The user can the hit the X on the geoprocessing panel to repeat the process with a different location.  This map could be optimized by allowing the user to save their outputs to be referenced at a later date.   

Figure 6: Output

Geoprocessing is an area of GIS that makes it so appealing to government agencies and private companies.  This relatively simple geoprocessing tool can make a multi-million dollar decision that much easier.  It also creates a visual representation of a phenomenon that would be hard to explain in words.  WebGIS has made it easy to give these tools to people who have no GIS experience.   Maps are a powerful tool and geoprocessing makes them even more powerful.

Sources:

Cyril Wilson
Monday, November 27, 2017

Volunteered Geographic Information (VGI)

Introduction:

In the world of data, data collection is expensive and tedious but necessary to give maps the life and power that they have.  WebGIS has opened the doors for new opportunities for data collection, the internet allows map and data developers to have immediate access to the public.  The public can then be used to collect data! In the world of GIS this is called Volunteer Geographic Information (VGI).  Other areas of the internet have been using this technique (crowd sourcing) to compile lots of information.  The most well known website that does this is Wikipedia.  Wikipedia is open to the public to add information and contains almost every topic one can imagine.  The field of GIS is now using this technique to collect all sorts of information.

In this lab a VGI app will be created that collects information about a cities infrastructure.  Information about broken sidewalks, healthiness of vegetation in green space and the color of fire hydrants will be collected using VGI.


Methods:


To begin creating a VGI application, a feature service needed to be created with empty features for the point class Fire Hydrant, line class for Sidewalks, and a polygon class for Green Spaces.  Domains were set for these features and they were given proper symbology.  These features were saved in a map in the live server and then published to that same server.  This allows the features to be accessed by people who are using the application.

Once the features are all set and published, the next step is coding the web application. 

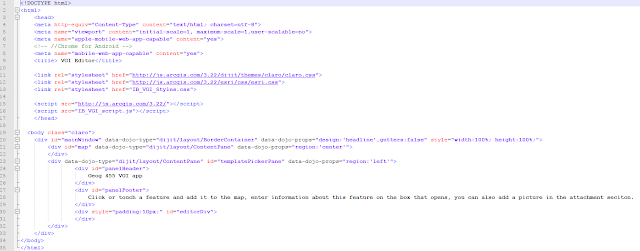
This first section of code is an html page that sets up the user interface for the application.  It is important to have a user interface that is friendly to people who are not familiar with GIS.  This html page calls in external CSS style sheets that create the borders and styling of the application.  The html page then calls in the javascript that creates the map and calls in the features.


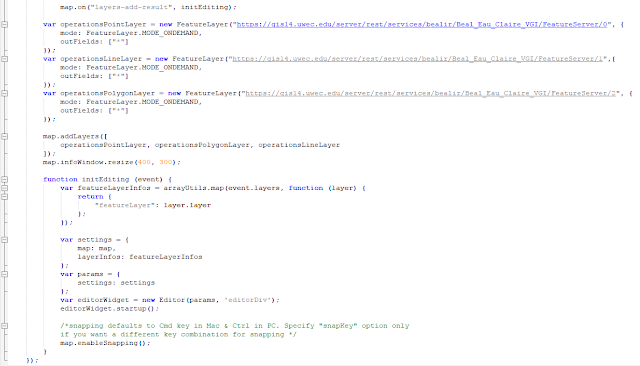
The image below shows the first part of the java script file that creates the map and calls in the features as feature services that were created in the first part of the lab.


The image below is a second screenshot of the js. file.  At the top of the page, the three feature services are called in as variables in the map.


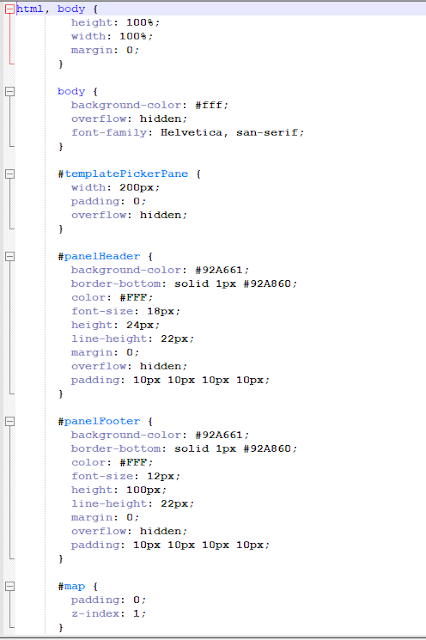
The last two images are a CSS page that sets the styling for the application.  In this code, widths and heights are given to different sections of the code. This gives the page a user friendly layout that is easy to understand.


The next section of the lab modifies the code so that the application is more user friendly towards mobile platforms. The code from the above pages was copied and added to new files.  A new page was also added in this section.  The html page was changed to make it more mobile compatible, and call in the toggle javascript page. 


The image below is the toggle page that was created just for this section.  The toggle page creates two variables for a map zoom slider and a toggle page.  It then uses an if statement to check if the size of the platform viewing the application is a certain size, and if it is, changes the size of the page. 


The only changes to the javascript file in the second part of this lab was to change http to https when referencing the services on a secure server. 


The css code was changed to reflect the toggle variable page that was added. A background image was also added to give the page some more life. Styling was given to the template picker that is used to turn the template picker on and off. 


Results:

The resulting webpage created from this code is a simple webmap that is not distracting to the user with the feature toolbar on the left for user to select an element and add it to the map.  The toggler on the top right of the page can be used to hide the toolbar on the left. 


When the user clicks an element to add it, then clicks on the map, a pop up window comes up and prompts the user to enter attribute information. 


VGI applications are very useful to collect information out in the world.  People that live in an area are most likely much more familiar with the place then people who would just be surveying it.  They can provide accurate information at no cost to the data producer.  In the case of the application that was created in this lab, the people providing the information have self interest in the data so they will provide quality data.  If they want their city to be fixed, they will provide accurate information.

Sources:

Ian Beal
ESRI
Dr. Cyril Wilson

Wednesday, November 15, 2017

ArcGIS API for JavaScript 2: Mobile responsive apps

Introduction:

With today's current level of technology, it is important that web mapping applications function just as well on a mobile device as they do on a computer.  This lab was designed to teach students how to optimize web mapping applications for different platforms.  In this lab, a query application was created that allows the user to search different features on the map.

Methods:

The first section of this lab was creating a web application that allows users to search for a location, congressional district, or a congressman via search bar located in the top of the map.  This was done by formatting an HTML file and connecting it to a JavaScript file that contained the code that allows the application to function.  Within the HTML page a viewport <meta> tags is used to make the page more responsive to iOS devices.  Meta tags are also added to make the page more responsive to chrome and android devices.

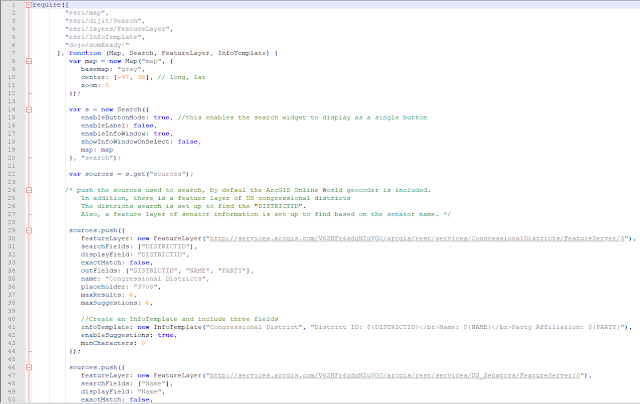
The following two images are the JavaScript files that create and give life to the query map application.  Modules are imported and parameters are accessed.  Within the JavaScript file, feature classes are imported as services and pop-ups are set.  The pop ups are coded to show certain fields from the features.  This is also where the search bar is created and put on the map.


The second part of this lab was to publish a service containing Universities around the United States and to connect this service to the web application and format it to search universities as well as the popup. This HTML page is similar to the one in the first part of the lab, it uses meta tags to make the application mobile responsive to different platforms.


The JavaScript for this application is similar to the first section but includes the universities as a service and the pop up is configured for the universities.


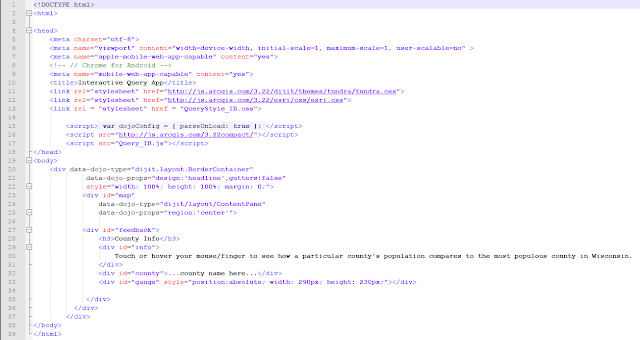
The last part of this lab was to configure a query application that compares the populations of counties in Wisconsin.  This application was configured to show a chart in the bottom left corner of the page that compares the county the user clicks on to the county with the highest population in Wisconsin.  This page is also set up to be responsive on all mobile platforms.


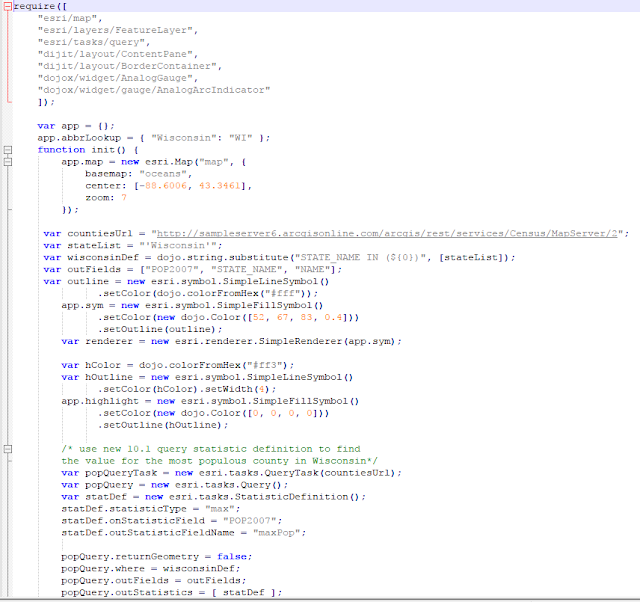
Within the JavaScript file of this page, modules are imported, parameters are set, the map is initialized, the gauge is created and the functionality of the gauge is set up.  The query is also set up for the county population that gives the gauge life.


Finally the CSS is created that gives the map layout life and formats the gauge in the bottom right section of the page.  The CSS also highlights the county in yellow that the user is hovering over.


Results:

This is the first lab that more function was given to the Web Applications created.  The search function created in the first part of the lab is a simple addition that shows up in most web mapping applications.  The search function is an easy way for users to easily find a place they are familiar with from there navigate to somewhere else.  Besides just finding locations with the search function, the search function allows users to search for things like a congressman, school , or congressional district, this is a very easy way for a person using the application to navigate a large amount of data.  The sky is the limit when formatting what can be searched for in the search bar, it simply needs to be added into the code.  The query application that was created is the most powerful thing that has been created in this class so far.  It takes data and manipulates it so the user just see's the result and not a clutter of data.  This only shows the user one aspect of data, in this case, percent population in relation to the most populous county in Wisconsin.  It is displayed using a gauge on the bottom of the page and allows no room for the user to be confused about what the application does. 

Tuesday, November 7, 2017

ArcGIS API for JavaScript 1

Goal and Background:

When creating a web mapping application, versions of the WebApp builder have been used up to this point.  This lab introduces the ArcGIS API for JavaScript 1.  This allows the user to create a web app from scratch.  This takes a certain amount of HTML and JavaScript coding skills.  The API allows the user to use many tools that ESRI provides, by calling them in their code.  This allows the user to have a large amount of control on what their application looks like and how it performs.  This is very useful in many situations where the WebApp builder limits the developer.  In this lab three different web applications will be created to show the capabilities of using ArcGIS API for Javascript to create web mapping applications.


Methods:

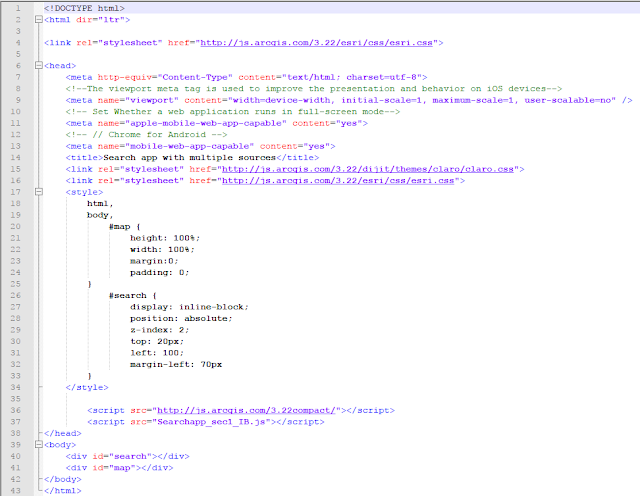
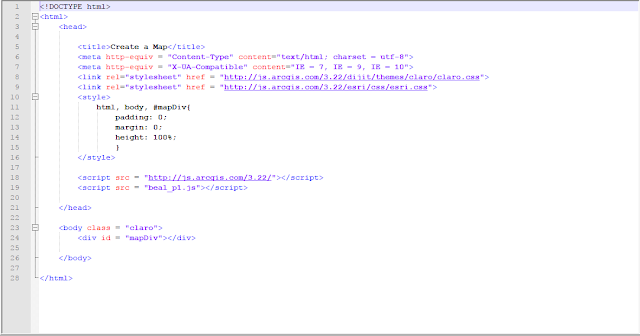
The first section of this lab was to write code that referenced esri and dojo's css style documents and to bring in a web map.  This first image is the HTML page that does this.  It also references the JavaScript file that opens the webmap.

This is the JavaScript file that is referenced in the HTML page above.  It simply calls in the map from the dojo library as a function and then declares the center, zoom and basemap.


Part 2
The second part of this lab was to build an online map with a functioning service built in.  This was done by creating a similar HTML page as the one above and calling in a more complex JS (Javascript) file.  This HTML page is almost the same as the one above but with a few slight differences.  This one uses a small amount of CSS within it to create a border, and set the height and width. The next difference in within the script tag.  This HTML page declares the dojoConfig variable and sets a few parameters for when the webmap is loaded.


The following image is the JS file that is referenced in the HTML page above.  This code pulls in a map from the Dojo library, sets parameters then brings in an ESRI sample service and inserts it into the webmap.


Part 3 of this lab was more complex than the first two.  This section of the lab was to create a routing application from scratch.  This was done in a similar was as the previous two examples except with different javascript for the functionality.  The HTML page is a simple page that sets the parameters then calls in the JS file.  This one has a short paragraph that shows up beneath the map to give the user some instruction on what the map does.


This JS file uses ESRI and Dojo libraries to call in the map and then use the ESRI routing service.


Results:


This first map is the simple map from part one.  The task was simply to call in a webmap.


This next map is from part two of the lab.  A simple wemap was pulled into the application and a feature service hosted by ESRI was placed on top of that webmap.  This is a very useful function that will be the basis of most web mapping applications.  The ability to have data on a map is what makes maps so powerful.


This last map is the routing application that was created.  This is a powerful yet simple application that was easily created.  The user simply has to click two points and a route is created.  This is a very simple application that can be expanded on and turned into a full out interactive routing application.  


Sources:

Cyril Wilson


Thursday, October 26, 2017

Basic HTML, CSS, and JavaScript

Goal and Background:

This lab is designed to introduce students to html, css, and javascript.  They will create their own website using html and give it life using css and javascript.  Having the ability to customize websites and create them from scratch has no limits to its value because with these skills, a person can create amazing interfaces to work with a map and more.

Methods:

The lab began by creating an HTML document in Notepad ++.  This was done by simply saving the file as a .html.  The html page was then formatted in the typical way a html page is formatted.  This consists of calling out the DOCTYPE as html, adding html, head, and body tags.  This is the basic format any html page should be set up as.  The next step was adding content to the webpage.  In html this is done very simply by adding a specific tag and putting text in that tag.  A title tag was added in the header with a title as well as four headers in the body.  


A few more lines of coded were added as paragraphs to show that the emphasis tag made text italic and the strong tag made text bold.  Next, a list was added to show how the list and list items tags worked.  This is very simple html but is key in adding content to a website.  The image below is what the html created looks like on a webpage.


This webpage has content but lacks design.  Cascading Style Sheets or CSS is a language that is used with html to give webpages color and design.  The next step to creating a good webpage was to open a new file in Notepad++ and to save is a CSS file.  CSS was then added to this page.  CSS is a simple language that calls out sections of the html code and gives is color and other parameters.  This is done by using a selector in css to select an element, specific object or group of objects in the html file.  Below is a sample of the css code written in this lab. 


This code calls out specific sections of the html and gives is color, fonts and borders.  This css page is then linked to the html page by calling the file in the html page.  Once this is done, the html page is given design.  The image below is what css does to the bland html page. 


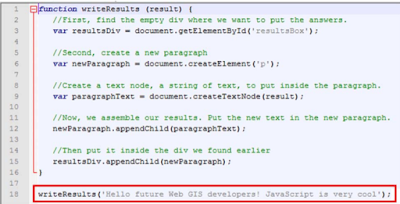
  The page is now starting to look like a real website. This is the basis of what was done in this lab, more code was added to add an input box as well as make the page look better.  A picture of the Web Mapping Application created in Lab 3 was also added with a link.  This is a good start to having a quality webpage.  The next step was adding some JavaScript to bring the webpage alive.  HTML and CSS are languages useful for formatting webpages but JavaScript is a scripting language that gives it the power to "think."  In this lab, JavaScript was written to combine text used in html to make a paragraph and display it in the webpage.  Below is an example of the script used,


The sample webpage was now complete and it was now time to create a mock webpage for a business showcasing a webGIS application.

Results:

Throughout a Geography students career at the University of Wisconsin-Eau Claire, they are required to make blog posts for many assignments in a variety of classes.  A lot of people use the blogger website (like me) and some people use weebly.  These blogs are then to be used as an online portfolio to showcase their work to future employers.  When they are getting to the point of looking for internships and jobs, they may discover that they want to make their blog page and profile look nice and fit seamlessly together.  They then discover that this task is very difficult using a template blog website like blogger.  No longer is this a problem!  This lab has taught the skills necessary to ditch blogger and create a website from scratch!  By the end of this class it will be possible for a standalone website to be created as an online portfolio.  This lab has laid down a solid foundation of HTML, CSS, and JavaScript skill needed to do this.

Sources:

Cyril Wilson

Thursday, October 12, 2017

Web App Builder

Goal and Background:

This lab was designed to introduce the students to building web applications using the WebApp Builder for ArcGIS online and using the developers editions.  No coding was actually done this lab but the basics of building and customizing web apps was introduced to have the knowledge needed when coding custom applications.

Methods:

This lab began with creating a web application similar to last lab using the online web app builder. Once this application was complete, it was to be brought into the developer edition of WebApp builder.  This is a more developer friendly version of the WebApp builder.  The developer edition gives the developer more power to customize and code their own applications.  In this case, the app created in the online WebApp builder did not transfer over to the developer edition.  The lab hinted that there were work arounds to get the app to transfer to the developer edition, or the app could just be recreated using the developer edition.  In this case, the app was not too complicated so it did not take long to recreate it in the developer edition.  Once the app was recreated, a custom widget was added to the widgets folder in the program files for the developer edition of the WebApp builder.  This custom widget was an elevation profile widget.  The widget folder was provided to the class and the tool was already completed.  This was simply copied and pasted into the program files.  This widget was now available in the widget section of the WebApp builder.  The following image is a screen shot of what the application looks like when it was completed.


To get this app to the internet from the developer edition, the computer needed to be connected to the gis server and the map could then be viewed from a url based off the folder path on the server.

Results:

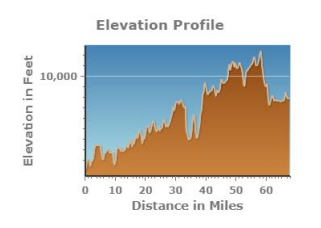
The online version of the WebApp builder is useful for a lot of web GIS situations.  For publishing maps and having a way to make them look good and be interactive this will satisfy that need.  To create web apps with powerful customized processing capabilities, the developer edition will have to be utilized.  Widgets can be created for almost any tool that is available in ArcMap Desktop, but a person will have to be well versed in coding.  This would be useful because once an app was created, people with little to no GIS experience could perform complex operation without even knowing it.  If an app is well put together the person using it will have no difficulties understanding what they are doing.  For example, creating an elevation profile in desktop is a bit of a process.  The elevation profile widget allows for this to be done in the blink of an eye.  The following image is a screenshot of what the elevation profile widget provides.

To use this widget, the user just needs to drag a line and gets this chart as a result.  The user can also download a excel table with the same data.  There are a few things that make this tool not as powerful as desktop.  It uses a topographic map and not a more detailed elevation model.  This would be very hard, if not impossible to get good elevation models for such a large area as the U.S.  let alone host all that data on one map.

Conclusion:

Web Applications in ArcGIS online and portal can be very powerful.  The developer edition gives the developer the capability to make even more powerful and customized apps.  In the right hands, an application can be created that performs complex processing operations without the user even knowing what is going on behind the scenes.  This is the bases of a good application, a map that is seemingly simple to the user but in reality there is complex operations going on behind the scenes. 

Sources:

Cyril Wilson, USGS, ESRI

Wednesday, October 4, 2017

Geospatial Web Services

Goal and Background:

The goal of this lab is to introduce the concept of creating geospatial web services through ArcGIS online, ArcMap, and ArcGIS Pro.  These services are hosted through the University of Wisconsin - Eau Claire Geography web server.  During this lab vector, raster and Excel/CSV data will be published.  This lab is designed to teach a basic understanding of one of the most important concepts in WebGIS, services.


Methods:

After the data provided by Professor Wilson was downloaded, the first step was to publish a service using ArcGIS online.  This is done by choosing the file to be uploaded in the "My Content" tab of ArcGIS online.  The .zip folder is selected and once appropriate tags are added the file is ready to be published.  "Add Item" is clicked and the item is published.  This layer was then added to a web map.  The following image is a web map of Wisconsin transportation created from the data uploaded using the online method.
Figure 1
This same method can be done using tabular data.  The next part of the lab was to save an Excel table as a CSV and then publish it as a service using ArcGIS Online.  This was very simple, the file was saved as a CSV file then the same exact process was used as above to import the X,Y data.  Latitude and longitude were selected and points were created as a service.  In this case, the XY data was representing wildfire in the United States.

Publishing a service through ArcMap is one of the most common ways to do it.  To do this, a map must be created and the data must have proper labels, field names, and symbology. Once the map is ready, the user needs to sign into ArcGIS online in ArcMap and the service is ready to be published. The user then shares the map as a service to the appropriate place in ArcGIS online and selects a few settings to optimize the map to what it will be used for.  The map is then published and shows up in the user's content in ArcGIS online.

The next method is publishing data using ArcGIS Server through ArcMap.  This is done in a similar way as previously but requires storing the data in a different place and connecting to the server.  Once the map is created the user must connect to the enterprise geodatabase.  This is where the data is stored that is pushed to the server. In this situation, each user is connected to their own enterprise geodatabase.  The data in the map should then be moved into this geodatabase.  The data in the map should then be mapped to this file and not the one in the local drive.  The next step is to publish the service.  This is the same process as publishing it to ArcGIS Online except it is being published to the server.  The place it is being published to is changed to the server address and the user is prompted to give the proper credentials.  Once this is completed the service can be published the same as before.  The service is now published to the UWEC Enterprise Server.

GIS is a relatively young field and is changing everyday.  ArcGIS Pro is the next big thing that will eventually phase out desktop.  The last part of this lab went through publishing a service to portal using ArcGIS Pro.  Once a map was created in pro with the proper data.  The map was shared as a web layer.  The appropriate summary and metadata information was provided and the map was then shared to the portal.  In this case it was actually shared to the server because the Universities portal was not up and running.


The last step of this lab was to create a map document, create a feature service, and add it to a web map.  This was done using ArcMap and published to the server.  Once the map and data was on the server it was brought into a webmap using the server address. Any service can be brought into a webmap as long as the user has access to it. Below is the resulting map. This is a map of earthquakes and hurricanes in the United States and shows them with a timer over a period of nine years.
Figure 2


Results:

Publishing data through ArcGIS Online is quick and easy way to publish a service but it does come with a few limitations.  The data published will not be normalized, symbolized, or cleaned up like it can be done in ArcMap.  This method of publishing only allows for 5gb of data to be published.  This method of publishing a service would not be the most recommended way to do it.

Publishing data to ArcGIS Online through ArcMap is one of the most popular and efficient ways to do it. ArcMap gives the user more control over the data before it is published.  The data can be manipulated and changed to fit the users needs before it is published.  Once it is published it is harder to change things such as field names and certain symbology.

Publishing data to ArcGIS Server is slightly more involved but results in more security around data.  ArcGIS Server is data that is hosted on a GIS server rather than online.  GIS servers are normally internally to companies but can be hosted though a 3rd party.  Having an internal GIS Server results in more security and control of the data.  This method is the way to go if using ArcGIS Enterprise. 

ArcGIS Pro is the next big thing in GIS.  ESRI claims it will eventually phase out ArcMap Desktop all together.  It is slightly easier to use but more confusing to use when the user does not have a lot of experience. Publishing was not harder or easier it was just different.

Using services in a webmap is very valuable.  There are many free services of valuable information published and hosted by private and public entities.  These can be brought into any webmap and shared.  This can be very useful in many real world situations.


Sources:
ESRI, Cyril Wilson, NASA, USGS

Thursday, September 21, 2017

Cloud GIS Basics

Goal and Background:

This lab was designed to teach the basics of using ArcGIS online as well as creating and sharing web maps and applications.  The objective of this lab was to create a web map and story map using data available to the user online.  The first web map created was a map of the big island of Hawaii and various features on it.  The next map created was a web map of Texas that was to be used as the base map of the story map application.  The last thing created was a story map of a field trip a previous geography class went on to Texas.

Methods:

This lab began by exploring different features in a online map created by our professor.  We logged into ArcGIS online using an organizational enterprise account.  The first map looked at was a map of Hawaii, Hawaii Island Lava Flow Risk. First, simple things were explored, such as, who made the map and when, how many layers the map had, and what tags did it have.  Once the map was opened, the layers and features of the map were explored,  a few base maps were added to show the difference a topographic base map and a LiDAR hillshade of the island.  After the map was explored, the next task on the agenda was to recreate the same map from scratch.  A blank map was opened and the feature layers were searched for using data that was available from ESRI.  Once the layers were added the symbology was changed and labels were added to the Volcano layer.  The resulting map is shown below (figure 1).

Figure 1
  
The next concept was to go one step deeper to create a web application.  To begin, a webmap was created with just the terrain with labels basemap, and zoomed in to the area over Austin Texas.  This map was saved and used to create the web app.  The web map being created was a story map of a field trip a previous geography class went on.  The story map template was used to create this web app.  Once the app was created the pictures provided of the field trip were attached to the story map.  When adding a picture the web app template prompts the user to enter information about the picture such as a description, title, and in this case a location.  The locations were provided and entered in by lat and long information as well as street address.  The web app then added those pictures to the story map in the correct location.  This was done for 10 pictures then the web app was shared to the world wide web! **Link to storymap below**

Results:

This lab successfully introduced ArcGIS online and web apps.  There was not a whole lot of on your own problem solving but it showed the basics of how to use the tool we will delve into further as the semester progresses.  A web map is beneficial because it is user friendly and anyone who has internet access can access it.  A web app is also very useful because it is a more streamlined way to show the person viewing the map, story map or whatever it is  specific information without them getting bogged down by other data that may confuse them.  The developer can create the app to show specifically what they want to show.  Both of these tools will be key components of GIS in the future and is a good corner of the market to be well versed in. A link to the story map is provided below.
http://uwec.maps.arcgis.com/apps/MapTour/index.html?appid=e819182fe3d040baa6712e5fa6bca2cc


 Sources:

ESRI